
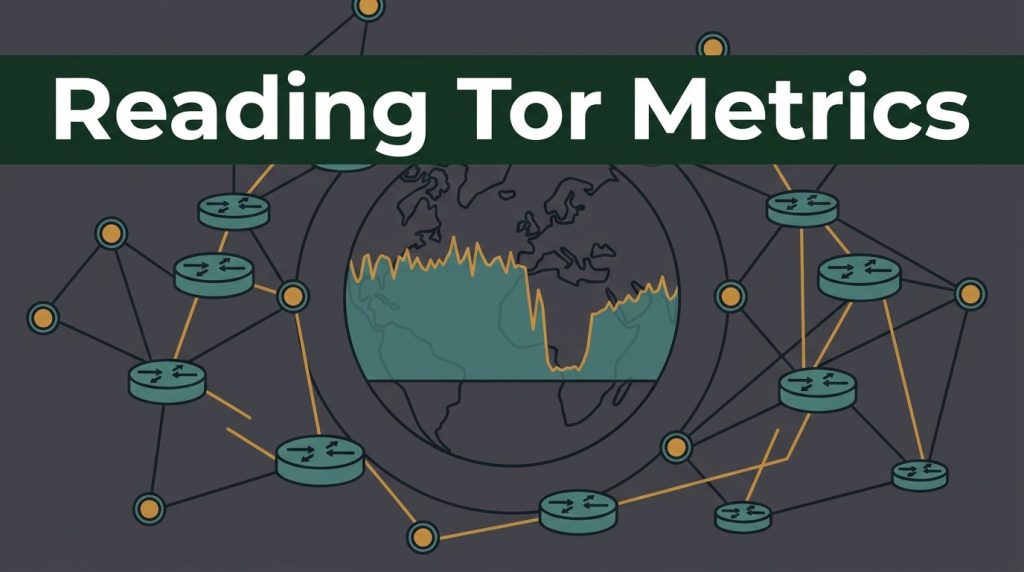
A sharp drop on a Tor network chart can look like a censorship event. Sometimes it is. Sometimes a relay operator went offline, a reporting delay occurred, or the network changed how it counts activity.
Tor metrics help you see the health of the network without exposing individual users. They are useful for journalists, researchers, privacy advocates, and anyone studying network activity. They can also show whether Tor Browser access is becoming harder in a country.
The key is to read several signals together, then separate a suspicious pattern from proven censorship.
How to read Tor metrics as a network map
Start with the Tor Metrics published scope. The project collects aggregate information about the Tor network, including Tor relays, bridges, bandwidth, users, and performance. It does not provide a live map of who is browsing the dark web.
Before looking at a graph, decide what you’re measuring. Are you checking relay health, access from one country, bridge use, or a possible block? A clear question keeps the data useful.
Know where a relay sits in a Tor circuit
Most Tor connections use three relay roles, and circuit selection determines how they form a path. The entry guard is the first relay a user connects to. A middle relay passes encrypted traffic between nodes. Exit nodes send permitted traffic to the public internet.
The exit nodes can see the destination of ordinary web traffic, but not the user’s original IP address. The guard sees the user, but not the final website. That middle hop links neither end directly.
Onion services work differently
These services were once called hidden services. A connection to a .onion address stays within Tor and doesn’t use an exit. Circuit selection therefore differs, and a fall in exit capacity doesn’t always mean they’re unavailable.
Public charts show relay counts, bridge counts, advertised bandwidth, consumed bandwidth, and estimated users. Bridge data from bridge relays can differ from estimates based on direct relay users.
A sudden loss of running relays may point to hosting trouble, a software issue, or coordinated downtime. A user decline in one country may point to a block, but it can also come from a measurement gap or a change in directory requests.
Think of the graphs as a weather report. They can show pressure building, but they don’t name the cause of the storm.
Check relay health before claiming censorship
Use Tor metrics to assess relay health before claiming censorship. A healthy Tor network has enough available relays, usable capacity, location diversity, and stable directory information. One number is never enough.
Compare relay bandwidth, consumed bandwidth, and weight
Advertised bandwidth is what relays report they can offer, while consumed bandwidth shows what they report carrying. The gap between advertised relay bandwidth and consumed bandwidth helps explain bandwidth distribution. It can indicate spare capacity or lower demand, and it gives context for circuit selection.
Consensus weight is different. Directory authorities assign it to guide circuit selection. A relay’s consensus weight fraction is a rough guide to how often clients may choose it.
The Onionoo API documentation provides current and historical relay and bridge records in JSON. Its bandwidth data, uptime records, relay details, and client estimates help turn broad charts into something you can inspect.
Don’t react to a one-day change. Onionoo bandwidth documents can lag because they update when a relay publishes a new server descriptor, which may take up to 18 hours in normal operation. If current data shows Germany with a large capacity share, that usually points to hosting infrastructure, transit links, and volunteer operators, not a large share of German Tor users.
Use relay counts, flags, and uptime together
Tor relays are best assessed through counts, flags, and uptime together.
The network consensus is the signed snapshot of relays accepted by directory authorities. The number of active relays shows what is running, while the consensus tells clients how those relays should be weighted.
Watch the number of relays carrying important flags:
- Guard relays can act as an entry guard, the first hop for users.
- Exit relays, or exit nodes, permit traffic to leave Tor under their exit policies.
- Fast and Stable show performance and reliability criteria.
- HSDir relays help store descriptors for onion services.
A fall in total relay count may not hurt users much if high-capacity relays remain stable. A fall in Guard, Exit, or HSDir flags can have a clearer effect on routing and descriptor availability.
Use Relay Search when a graph points to a particular relay. Check its country, advertised bandwidth, flags, version, uptime, and recent status to see how availability affects circuit selection. Fractional uptime is more useful than one online snapshot. A relay that is online today may still have been unreliable for weeks.
A practical workflow for reading Tor network data
A repeatable routine makes OSINT workflows more reliable and helps you avoid drawing a big conclusion from a small change.
- Freeze the question first. Write down the country, dates, and metric you’re checking. Ask whether a reported block changed direct use or circuit selection. That is easier to test than asking, “Is Tor being censored?”
- Build a baseline. Compare daily active users for the last day with seven-day and 30-day patterns. Use the same weekday where possible. Weekday and 30-day baselines help separate ordinary network activity from unusual changes.
- Compare related signals. Pair relay bandwidth with the broader bandwidth distribution, running relay counts, and relay flags. Add direct-use data, bridge-related signals, and pluggable transports where available. A meaningful event usually leaves more than one trace, but aggregate data can’t show an individual’s circuit selection.
- Inspect the relay records. Check whether the capacity drop came from many small Tor relays, one large operator, or one hosting provider. Review active relays, their status, and consensus weight. A single hosting provider outage can look dramatic on a global chart.
- Record the confidence level. Use wording such as “consistent with interference” or “requires more confirmation.” Save the date range, graph settings, and data source so another researcher can review the same evidence.
For long-term work, keep a simple timeline of geopolitical events, outage reports, Tor releases, and metric changes. The timeline often reveals a less dramatic explanation.
Patterns that can point to censorship
Censorship is usually visible as a pattern in Tor network activity across time and related data. A falling line alone doesn’t prove it.
Compare direct access with bridge activity
Tor Browser country charts estimate a user population through directory-related requests. These country estimates aren’t a direct count tied to an individual IP address.
Users connecting directly and users using bridge relays aren’t the same population. Direct-user graphs exclude people who connect through bridges.
A sustained drop in direct connections from one country, followed by higher bridge use, may be compatible with blocking. The same pattern may appear when users switch to pluggable transports such as Snowflake or obfs4 for censorship circumvention.
A sharp decline in one bridge transport can also point to targeted filtering. Reduced access to onion services may fit the pattern, but service outages can look similar. Bridge distribution may have changed, a transport may have failed, or users may have switched options. Check timing against geopolitical events before treating either change as a block.
Check directory authorities and relay concentration
Directory authorities create the consensus that Tor clients use to learn which relays are available. If access to directory authorities or mirrors is disrupted, users may struggle to bootstrap. The disruption can also affect circuit selection, even if relays remain online.
Use Consensus Health and relay records to check for a broader consensus or authority issue. Then compare the affected country with nearby countries and global traffic. A problem that appears worldwide is less likely to be a national censorship event.
Also check concentration across autonomous systems. Several Tor relays in different cities may still depend on the same provider. Relay bandwidth can look geographically broad, but provider concentration can still leave a weak point and increase traffic correlation risk.
A censorship finding needs a repeated country-level pattern, related bridge or transport evidence, and independent reachability checks from affected networks.
Data limits, privacy, and safe research
Tor Metrics is public and useful, but it has blind spots. Treat estimates as estimates, and record geopolitical events separately from technical observations.
What Tor data cannot prove
Daily user figures come from client requests to relays, bridges, authority servers, and mirrors. They aren’t a headcount, so treat these user statistics as estimates. Shared IP address use, mobile networks, country geolocation errors, and network address translation can affect totals.
Relay flags are also not trust scores. A Fast or Guard relay meets directory criteria, but no public graph can prove that an operator is harmless. Capacity measurement methods change over time. When comparing TorFlow-era figures with newer work using the FlashFlow framework, check the method, date range, and capacity definition first.
Botnets can use onion services for command-and-control communication, but public metrics don’t reveal an individual’s circuit selection. Network-level measurements show changes in network activity, but cannot identify a botnet operator or prove a service is malicious.
Keep onion research lawful and cautious
People searching for Verified onion links, verified tor websites, or other hidden services should keep dark web directory listings separate from network-health data. A link marked as verified isn’t proof that a service is safe, legal, or unchanged.
Names such as Tor Taxi and Tor Watch may appear in directory discussions. Links to dark web marketplaces can appear there too. Don’t use public metrics as a reason to visit illegal services, make purchases, download material, or interact with suspicious infrastructure.
For legitimate research involving onion services, use the Tor Project’s v3 onion-service guidance. Version 3 addresses are 56 characters long, and version 2 services have been unsupported since 2021. Keep research passive where possible with Tor Browser, protect your identity, and collect only data you’re authorized to handle. A virtual private network differs from Tor-based censorship circumvention, and neither guarantees safety.
Frequently Asked Questions
Do Tor metrics show who is using the network?
No. Tor Metrics publishes aggregate estimates about relays, bridges, bandwidth, and users, but it does not reveal individual users or their circuit selections.
Does a sudden drop in Tor users prove censorship?
No. A drop may result from censorship, a reporting delay, a relay outage, or a change in how activity is measured. Compare direct-use data with bridge activity, related countries, and global trends before drawing a conclusion.
What is the difference between advertised bandwidth and consensus weight?
Advertised bandwidth is the capacity a relay reports it can provide, while consensus weight is assigned by directory authorities to guide circuit selection. Comparing both helps show whether available capacity is likely to affect routing.
How can researchers check whether a relay outage affected the network?
Use Relay Search and Onionoo to review the relay’s flags, bandwidth, uptime, version, country, and recent status. Check whether the change affected one relay, a hosting provider, or many high-capacity relays before treating it as a broader network event.
Read the Pattern, Not the Panic
Tor metrics are most useful when they answer a narrow question through several supporting signals. Compare bandwidth with relay counts, flags with uptime, and direct connections with bridge trends.
A censorship claim needs more than a sudden dip. Compare metric changes with relevant geopolitical events before drawing conclusions. Careful comparison turns public Tor data into useful defensive research while protecting the privacy Tor was built to support.